Introduction
I have been receiving emails from No Fluff Jobs, a job board I signed up for a few years ago to get job alerts. Over time, I’ve accumulated over 2,000 emails with data on job titles, salary ranges, locations, remote status, and company names. This feels like a treasure trove of information, so I decided to finally extract and analyze it. I’m sure there are existing tools that could have made this simpler, but I wanted to try out Google’s Gemini 2.0 Flash-Lite for cost efficiency and the possibility of reusing it for future email parsing tasks.
I've recieved over 2,000+ emails like this one
Getting the raw data
Initially, I tried using simplegmail to pull out all the emails, but that quickly exceeded my API quota, even when filtered for this year’s emails alone.
Fortunately, Google Takeout makes it easy to export your data into neatly organized ZIP files. I created a filter in Gmail to isolate the No Fluff Jobs emails and applied it to existing messages. However, only a few emails appeared on the first export. An hour later, another export got me a few hundred emails. It seems it may take time for Google Takeout to apply all those filters. After a few more hours (or days), I expect the full 2k+ emails to be available for export.
Why LLMs Make This Easier
Before large language models (LLMs), extracting data from raw HTML was challenging. Different currencies, small HTML changes over the years, or layout differences would complicate a simple regex approach. With an LLM, you can process these variations far more reliably.
Cleaning the data
The first step was to extract the raw text from the mbox file, including the email’s received date. This will be helpful for analysis later and give more granular data. Next, I converted the HTML to Markdown to reduce the number of tokens the LLM has to process. While the raw HTML likely contained more semi-structured data, I opted for easier handling here and potential cost savings. Finally, I used Google Gemini 2.0 Flash Lite to extract job listing data from the now minimized Markdown text. The data is serialized into a Pydantic model for better structure and consistency.
 See the code now on GitHub
Analyze the data we've extracted
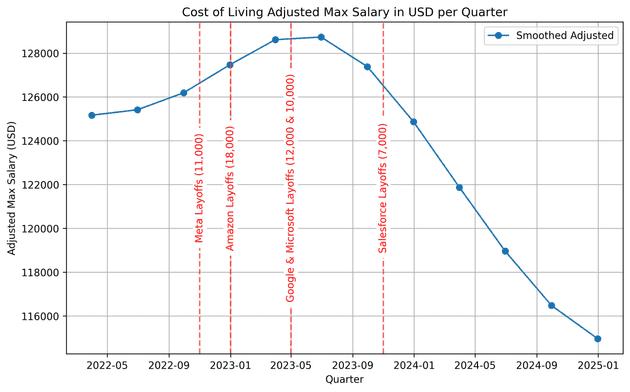
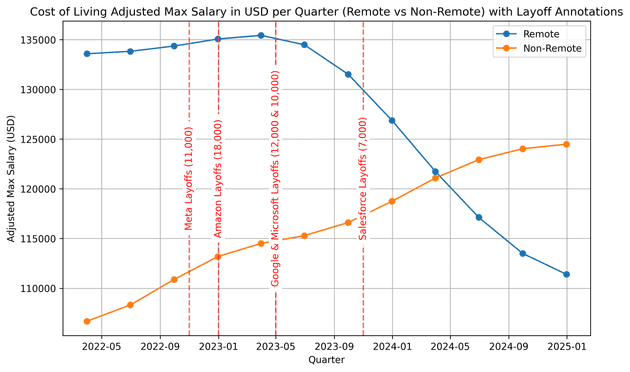
To explore this dataset of tech job listings I converted salary data into annual USD amounts because I'm american and this is easier for me to read. Then adjusting for cost of living across different countries. After dropping rows with missing values and parsing timestamps, I resampled the data quarterly and smoothed it with a Gaussian filter to visualize salary trends over time. I overlaid major tech layoff dates from Meta, Amazon, Google, Microsoft, and Salesforce on these charts, which helped me spot how industry-wide events might correlate with shifts in pay.
Please keep in minda these results are just data points from emails about job posts that I've gotten and there's not enough data points to really make any real assumptions from this. This is just something I thought would be fun to do with data that I had been passively collecting over time.
It looks like the massive layoffs in big tech companies drove salaries down and lead to a decrease in salaries for remote jobs. But there as an increase in non-remote jobs which when accounting for inflation might not be such a huge bump in pay.
Conclusion
This was fun to work on and I finally got to pull the data out of those emails I had been recieving from the pre-ChatGPT era when this would have been much harder to do. It's really wild with how well priced Gemini 2.0 Flash-Lite is at just pocket change per 1M tokens. This little experiment costs basically nothing to run and I think I'll do more things like this because of just how affordable and easy it is to scrape data. The resulting graphs were not surprising given what's been coming up in other posts/videos and the news. But I don't think that just using the email notifications like this is enough of an indicator to really tell an accurate story about what's happening in the job market right now.